Is there a template to successful digitization in India? - Part 2
Building a digital business in a market where revenue earned per transaction shrinks as your offering democratizes

If you are a venture investor putting extremely high risk capital in Indian start-ups, I would assume that you have a definite growth path charted out in the industry that your invested company is trying to disrupt. You would expect the first 12-18 months roughly to be the era of tech enthusiasts and early adopters, using your product and providing valuable feedback for better future iterations. At some point after that the demographic or policy tailwinds that you would have bet on would likely kick in, driving the mass adoption of the product sold by your portfolio company. Your product democratizes, deepens its base and adds new features to keep its customers loyal.
Eventually the idea is that the average revenue per new user will increase, as your product becomes more valuable to each new customer because it already has incorporated their needs through feedback from older customers. In short, your average transaction size per user should go up in the long-run, as you become more embedded and more valuable to their lives.
Of course, I am assuming here that you are a rational venture investor.
How does the evidence from the three most digitized economic domains of our lives stack up against this theory?
The chart below shows the Average Transaction Size for UPI and NETC-FASTAG since December 2016 in nominal terms. I have indexed both prices at 100 for December 2016.
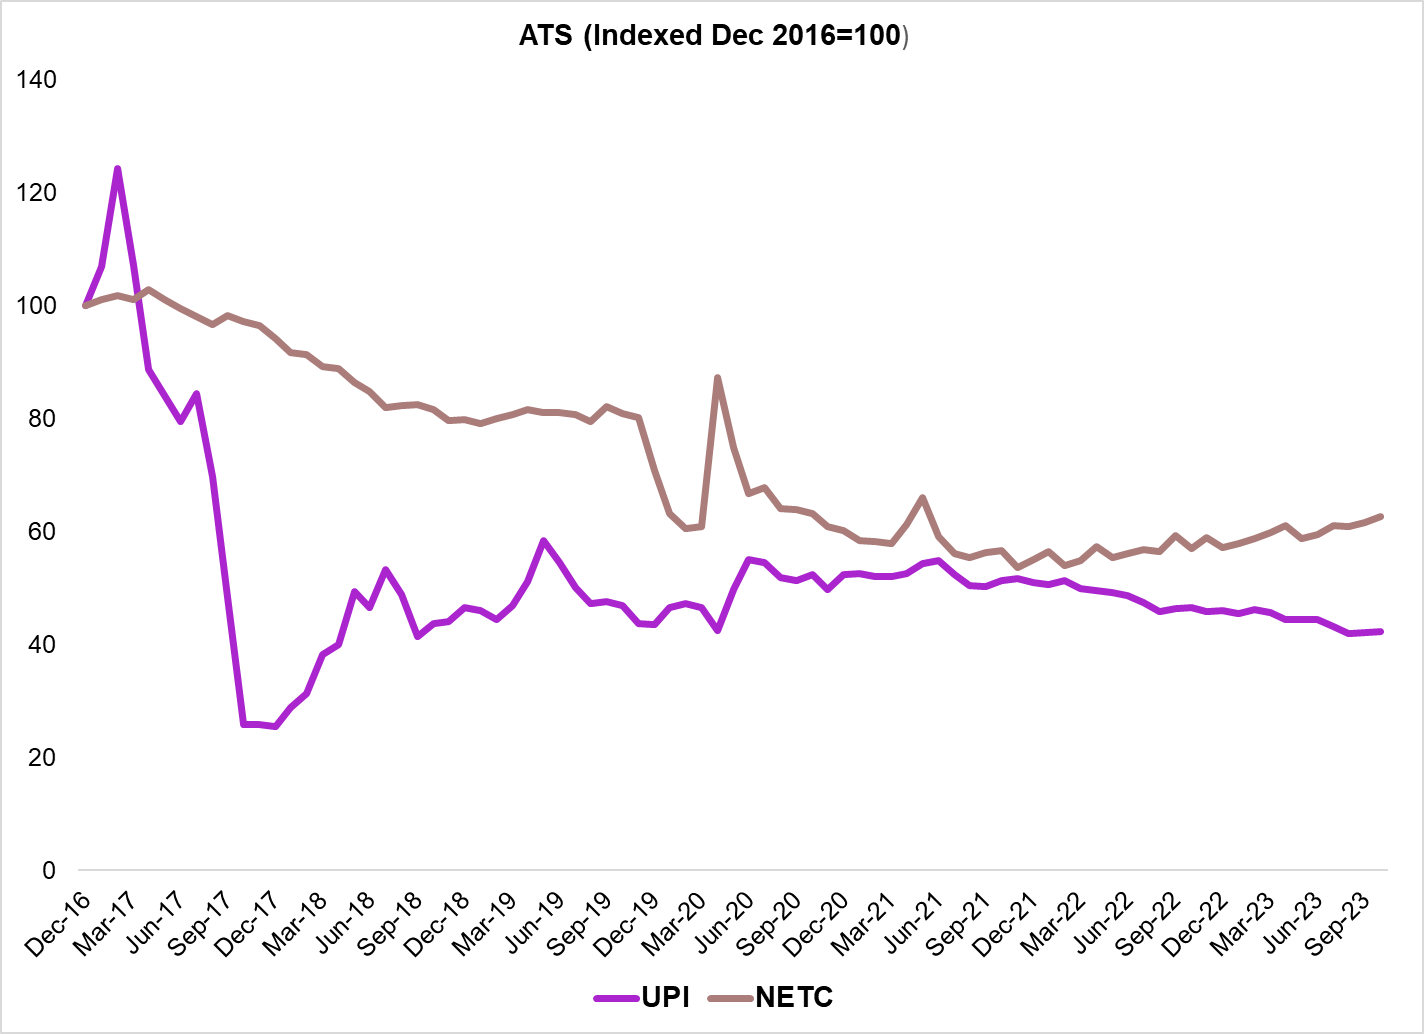
Figure 1: An average UPI transaction was ~42% of its value in October 2023, compared to December 2016; A similar measure for NETC-FASTAG would be ~62% of its value in December 2016. Source: NPCI
The numbers fall off even more steeply when we adjust them for inflation. The chart below measures the former two ATS in inflation adjusted terms. I have also added data from SEBI on Average Trade Sizes in the F&O and Cash equity segments, adjusted for inflation. As before, I have indexed all these numbers to 100 for December 2016.
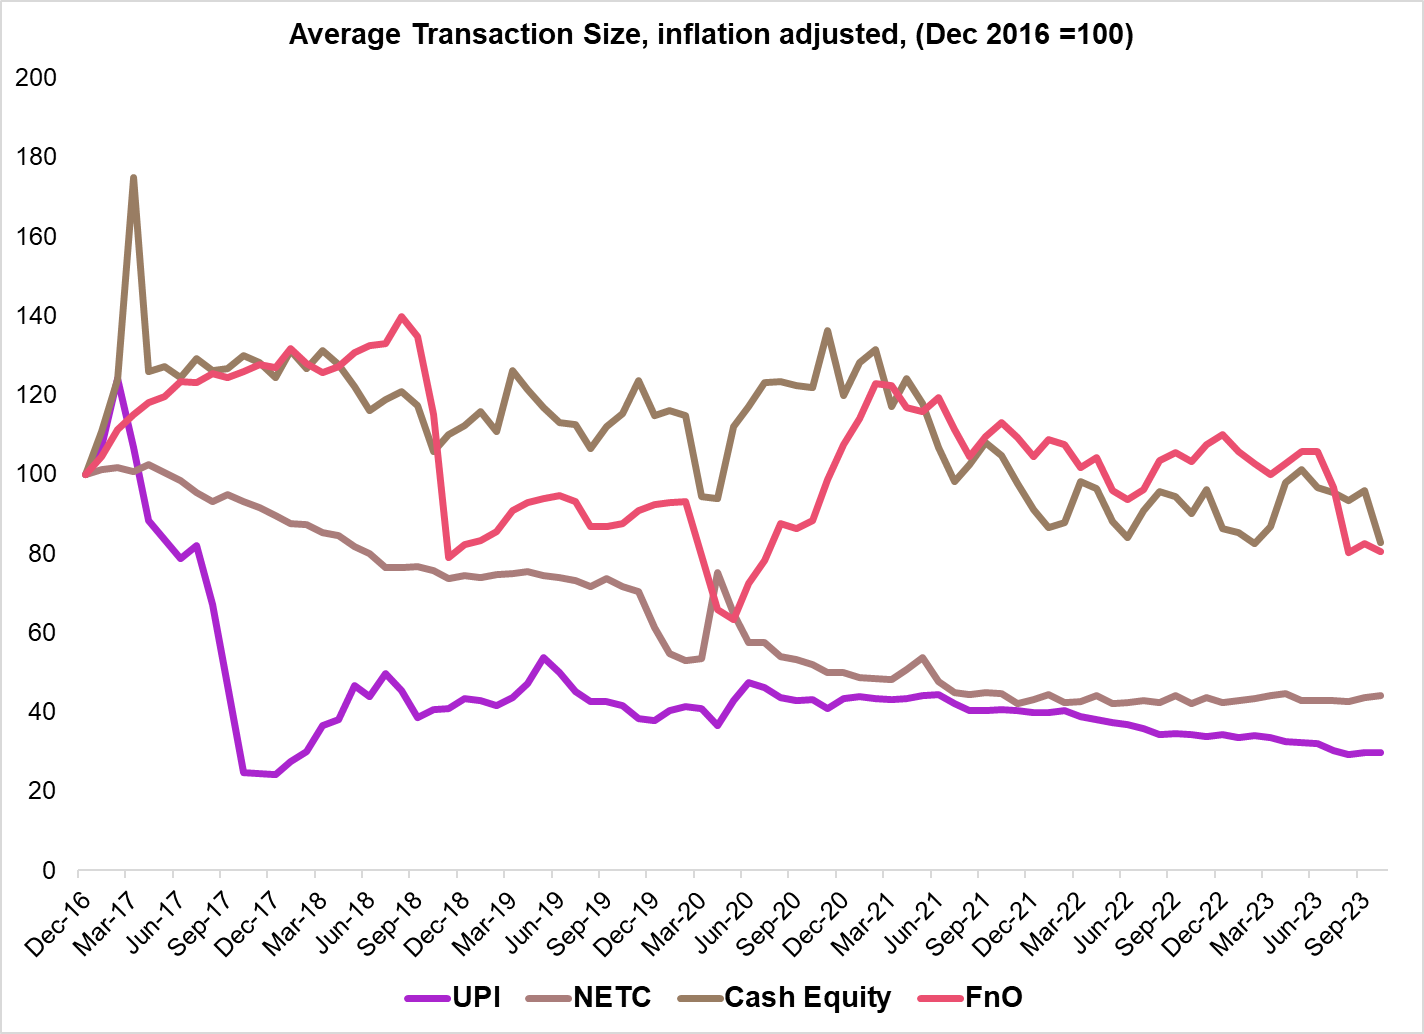
Figure 2: UPI’s Average Transaction Size has fallen by more than two thirds in inflation adjusted terms, NETC-FASTAG’s by more than half; Even ATS for Cash Equity and FnO segments has fallen, despite the markets touching new highs. Source: SEBI, NPCI
For me, the more surprising aspect of this analysis was the ATS for Cash Equity and FnO segments. Usually, as markets go up, given the preference for investments assets remains the same, you would expect some increase in average trade sizes, as people would want to pay more to acquire those shares/ futures baskets in order to take bigger bets on the market. That has not happened.
Even as prices are up 40% in the past seven years, the average size for an equity trade has gone up from INR 22K to INR 26K. That of an average FnO bet has gone up from INR 663K to INR 757K. Clearly, both have lagged inflation.
In the electronic toll collection space, the average size of a transaction per tag has fallen from INR 4221 in December 2016 to INR 708 in October 2023. Contrary to theory, the new customer is also not someone who is somehow passing toll plazas more frequently. Average number of transactions per tag is 4. It was 15 seven years ago.
What could explain this?
I have explored this falling ATS trend, as UPI democratizes, in a previous essay as well. I believe that we are a digitally well penetrated nation in banking terms at present, but yet have low per capita savings. Ergo, as bank account access has risen from 44% of the total adult population in 2011, to 78% in 2021, many of the newly acquired customers have been on the lower end of the income pyramid. A good evidence for this hypothesis is the average savings account balance in the country, which has remained stagnant between INR30,000-40,000 over this decade.
For the lower middle class which saw this increase in banking access, there isn’t a big case for using UPI in differentiated transactions, given the limited savings balances at their disposal. The difference in transaction sizes for making payments for utility bills, rent etc. and for those like discretionary purchases and P2P payments isn’t likely to be as significant as it would be for higher income cohorts (which were early adopters).
This dynamic also explains to a large extent the stagnation in ATS in the brokerage space as well. Low per capita savings means low corpus to invest for the newer cohort of traders. This is also borne out by the fact that much of the growth in new retail accounts has been in relatively lower per capita income states in India - Uttar Pradesh, Bihar and West Bengal. Maharashtra is the exception.
Within the electronic toll collection space, the fall in ATS with greater digital diffusion is explained by the fact that over 60% of the new FASTAG issuances in the last 2-3 years have been to passenger cars, for whom the toll collection is almost 1/5th of that of commercial vehicles. Greater penetration of FASTAG has also taken it from being a sticker purchased by commercial fleet owners - who are far more mobile, to that being purchased by passenger car owners - who travel much less.
This is a challenge, if not a matter of concern, for shareholders in the leading companies in the domains where digitization has happened. Seven years is a long time to wait patiently, even as your marginal revenue per user continues to fall.
Digitization is like mining- the more you dig up a site, the lower is the yield per kilogram of ore
All this trend in ATS as discussed above is, say, different from digitally underpenetrated segments of population in a country in Europe.
In societies that were already prosperous pre-internet, changing customer defaults and bringing the internet-shy cohorts online, as happened in the US and Europe, led to an increase in marginal revenue per customer and a higher average transaction size. That logic hasn’t worked for India. The vast wealth and income inequalities in India (at a two decade high) mean that the digitally reclusive are highly likely to be people with poor internet access and income levels.
Modern India emerged as an economic powerhouse in the post internet era. Hence the first adopters of digitization were also its high value users. Regardless of any government measures to come, it is likely that as digitization democratizes economic transactions, newer users are likely to be adding less and less to total revenue in the near future.
What this implies is that building a hyperscale digital business in India doesn’t just require favorable policies to enable digital diffusion, it requires a dramatic reduction (perhaps more than anywhere else) in costs per new customer (acquisition and lifetime) so as to keep them below the gradually declining ATS.
Based on my conversations with senior executives in some of these firms, there are four components to the Total Variable Cost (TVC) per customer that can be optimized - data storage, compute & tech infrastructure, marketing and security & compliance costs. The last cannot be squeezed too far, given the reputational and regulatory risk even a single failure poses to the company. The other three - costs of storage, tech infrastructure and marketing - are where the real savings to variable costs lie.
I wish I could say that market leaders in domains where digitization has progressed enjoy a cost advantage in one of these three domains and hence present a case study to be emulated. It is perhaps a paradox of digitization in payments, electronic toll collection and brokerage that the efficiency and greater good of the Indian public at large hasn’t yet resulted in sustainable profits for any of the market leaders (with the shining exception of Zerodha). It also highlights how tough is the challenge posed by the steadily falling ATS curves to the patience and endurance of both founders and investors. I wish I had any theories or solutions to suggest at this point. But I don’t have any.
For the industry incumbents then, maybe the money doesn’t lie in the fees they make from enabling the transactions for customers or merchants. It could be about capturing the data around their payments, toll movement and trading behavior which could be used as keys to open bigger revenue pools - personal lending, working capital finance and fund management respectively.
Might this anticipation, and how certain are the adjacencies between these revenue channels, give rise to differing competitive structures within payments, electronic toll collection and broking?
That will make up the next part of this essay.